What the 248 comparable districts did
A district is comparable when it has recorded canonical-vendor spend in FY2023 and any FY2025 record. Of the 275 districts in the four-state universe, 27 are not comparable and are reported separately rather than dropped.
The finding, stated so you can disagree with it
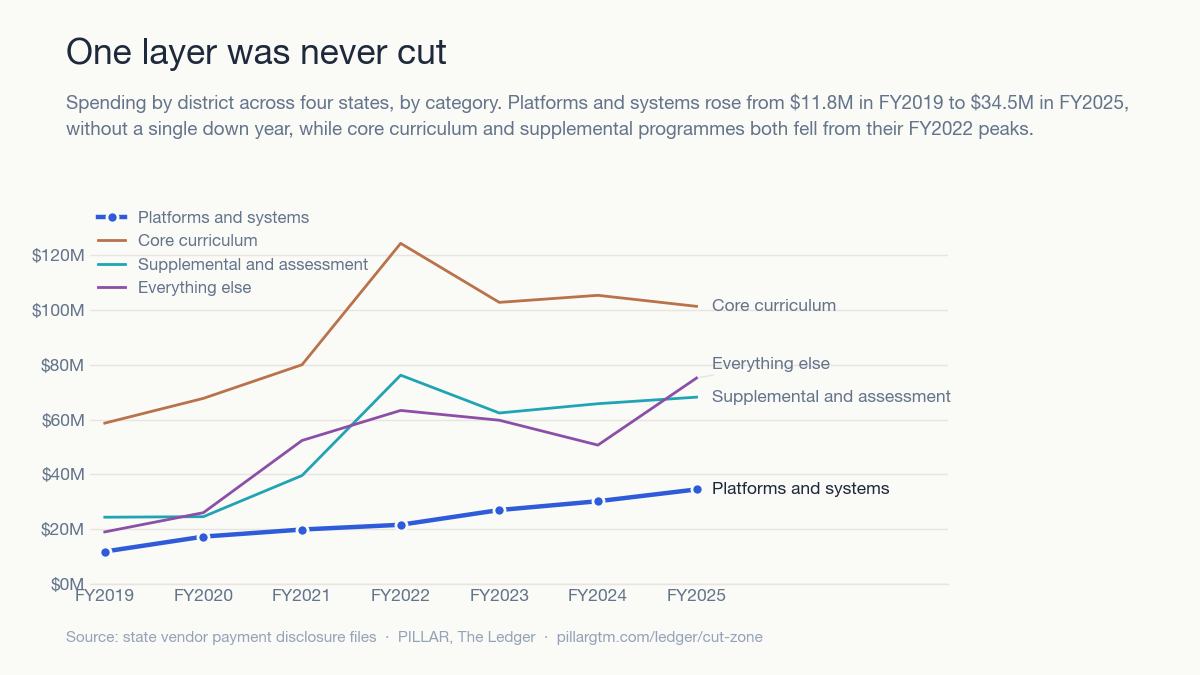
Districts are not holding the line on technology spending. 46 percent of them cut what they pay named education vendors by more than a tenth in two years. What never got cut, in any year since 2019, is the platform layer.
Platform and system spending across these four states rose from $13.9 million in FY2019 to $34.5 million in FY2025, without a single down year, while supplemental and core categories fell from their FY2022 peaks. If you think that reading is wrong, the district-level file is public and so is ours.
| State | Comparable districts | Cut >10% | Cut >25% | Grew >10% | Cut share |
|---|---|---|---|---|---|
| Delaware | 29 | 15 | 11 | 10 | 52% |
| Maryland | 23 | 7 | 5 | 14 | 30% |
| Utah | 145 | 70 | 54 | 61 | 48% |
| West Virginia | 51 | 23 | 17 | 23 | 45% |
| All four | 248 | 115 | 87 | 108 | 46% |
Where this number comes from
- Source
- State vendor payment disclosures published by Utah, Maryland, West Virginia and Delaware. Public records, no survey and no estimate.
- What is counted
- Payments to vendors PILLAR has matched to a canonical identity through documented, reviewed rules. Named instructional, assessment and platform providers. Hardware and device refresh are excluded.
- Years compared
- FY2023 against FY2025, the two most recent fiscal years complete across all four states. FY2026 is still filling and is never quoted.
- Disclosure floors
- Maryland publishes payments at or above $25,000 by statute. Utah is filtered at $1,000 on ingest. Spend below those floors is invisible to this record in those states.
- Known limit
- District totals are lumpy, because curriculum is bought on adoption cycles rather than evenly. That is why this reports threshold shares rather than averages, and why a single district's move is weaker evidence than the distribution.
- Query
- LEDGER_Q_DISTRICT_CUT_SHARE_v1, production run 2026-08-22. Development environment verified at parity on the same date.
Take it and use it
Nothing here needs permission or attribution beyond the source lineThe finding travels better when other people carry it than when we repeat it. Both charts are built from the same query as this page, print their own source line, and are free to reuse.
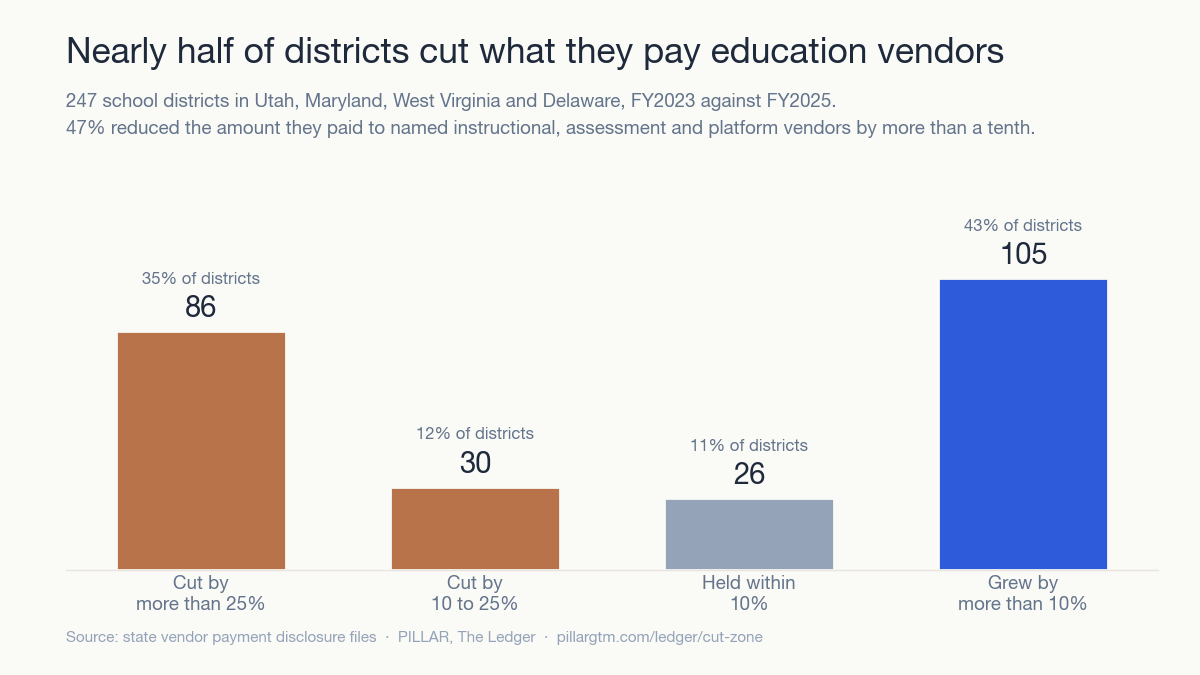
46 percent of 248 school districts cut what they pay named education vendors by more than 10 percent between FY2023 and FY2025.
The cut was real and it was brief. FY2023 is the trough in these records, and by FY2025 supplemental spending is at an all-time high while core curriculum has recovered most of the way. Platform and system spending is the exception in the other direction: it never fell in any year from FY2019 to FY2025.
Four states only. Canonical-matched instructional, assessment and platform vendors, no hardware. Maryland discloses at or above $25,000 by statute. District totals are lumpy because curriculum is bought on adoption cycles, which is why this reports threshold shares rather than averages.
carry-kit.json has all of it in machine-readable form, alongside districts.json, segment-trend.json and state-fy-totals.json.