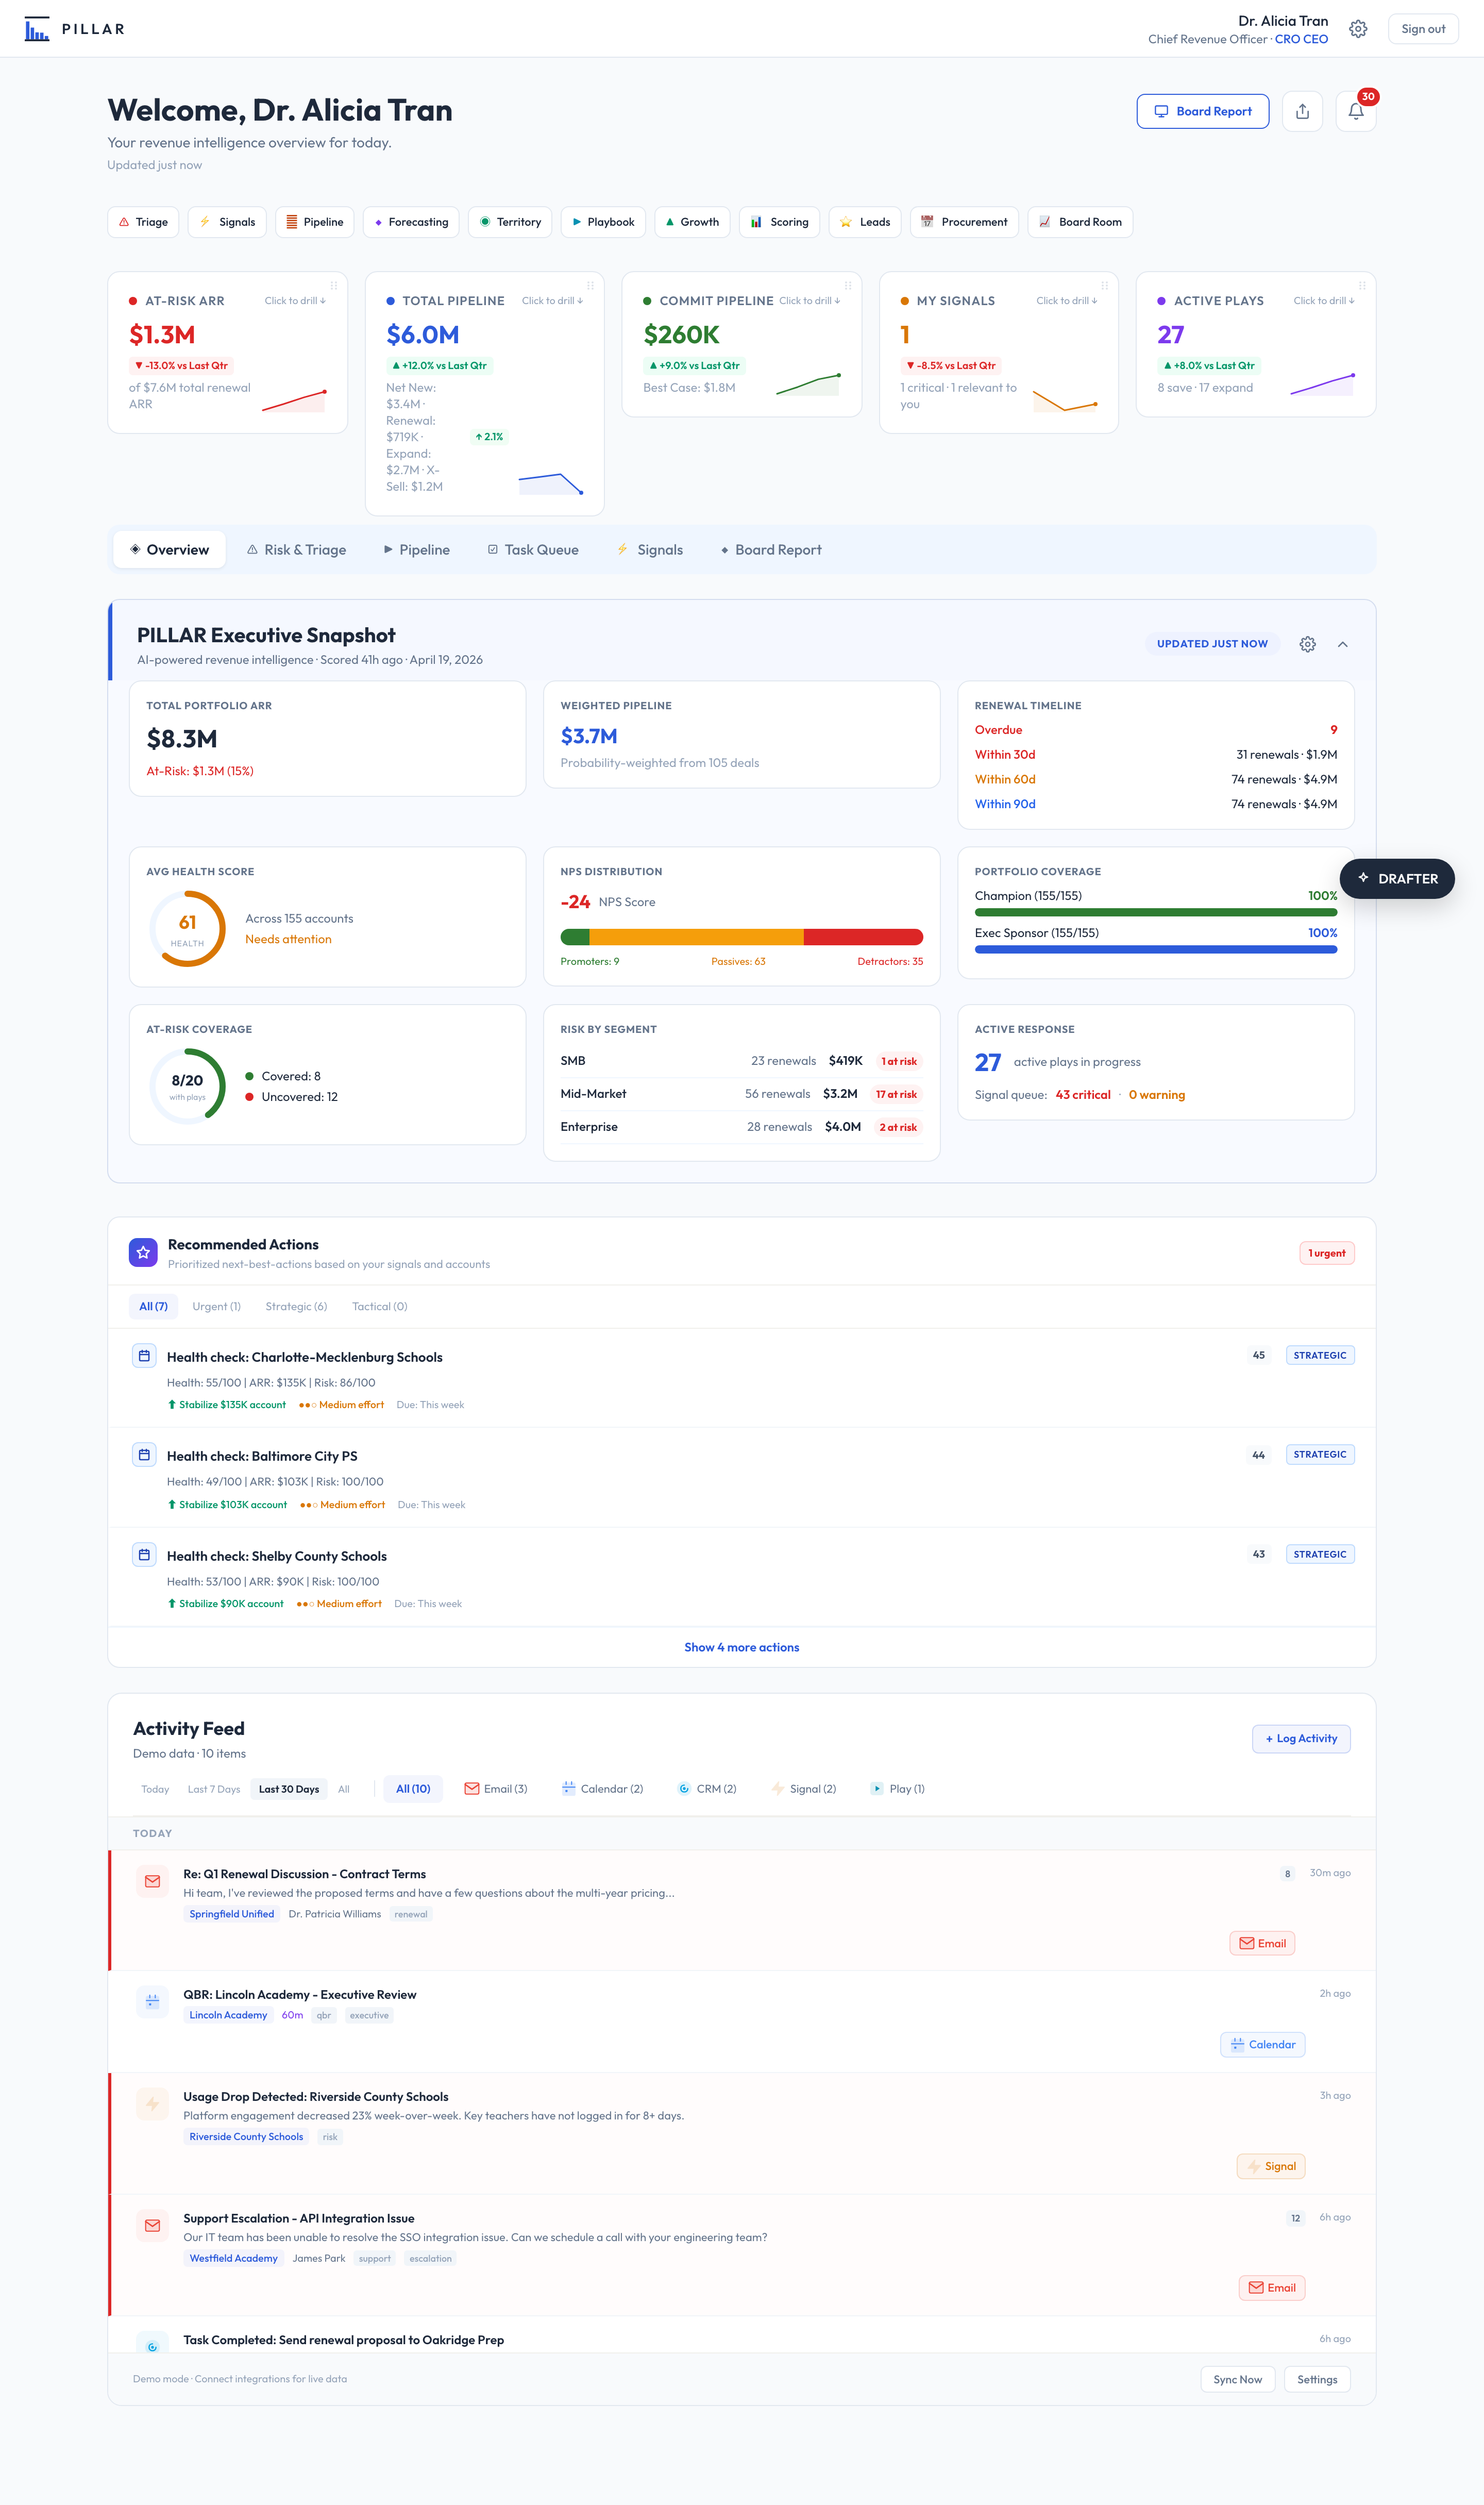
Your CRM records what already happened. PILLAR tells you what is about to. It follows the funding, leadership and procurement signals moving through every district you sell to, and routes the next move to the person who owns it. Built for EdTech and the public sector.
See where your revenue architecture stands - for free, in 20 minutes.
Every account, contact, deal, and renewal scored and ranked - so your team focuses where the impact is highest, from boardroom to field.
Signals explain what's happening and why. Plays tell your team what to do next. Governance ensures the numbers mean what you think they mean.
Executive, Sales, CS, Growth, and RevOps all operating from one governed engine - not five disconnected dashboards.
What if your Monday morning revenue review started with one number everyone trusted? What if pipeline, retention, and expansion lived in the same system? What if anyone on your team could answer - right now - which accounts have the highest combined opportunity and which need attention first?
Most revenue teams have strong tools - the CRM, the horizontal revenue AI platform, the CS platform. The gap is the operating layer above them. Pipeline doesn’t see what’s happening in CS. CS doesn’t know what was promised in the sales cycle. Leadership builds the board deck from four dashboards and reconciles by hand. PILLAR is the architecture that replaces that manual layer.
Open PILLAR. See your entire revenue architecture - pipeline, renewals, signals, and plays - before your first meeting of the day.
8:02 AM - every at-risk account, open play, and revenue signal before your first meeting
Five tiles. Five sections. Each one deep-links into the part of PILLAR you most want to see - no scrolling required.
Monday, 8 AM. Every deal, every renewal, every territory, every number your board will see next week - scored, connected, and waiting for you. No one reconciled a spreadsheet. You walk into the board meeting with facts, not feelings. The system just runs.
Most tools cover one side of the customer journey. PILLAR governs the entire revenue architecture - with intelligence at every stage and every growth channel your organization invests in.
Your leadership team sees one source of truth, not six dashboards. Every signal, score, and action connected across the full lifecycle.
Right now, there are signals across your accounts that your CRM and your revenue tools structurally cannot surface. PILLAR can.
District intelligence powered by native integration with Starbridge.ai. FOIA-sourced contracts, board meeting minutes, budget filings, and contacts verified from public district directories. Data your horizontal CRM was never built to see.
Want to see what PILLAR surfaces for your accounts?
Your 4-AE hiring plan looks great on paper. At 71% attainment, it produces negative ROI for 14 months. PILLAR catches it before the hire - with 3-scenario modeling, 12-month cashflow projections, and breakeven analysis calibrated against industry benchmarks.
No other revenue platform connects headcount economics to pipeline coverage to territory health. PILLAR does - because your CFO will ask, and you need the answer before the board meeting, not after.
These are real questions from revenue teams we’ve worked with. The need is the same - the tools don’t connect, the context is scattered, and the numbers need reconciliation. PILLAR answers each one differently.
Feature requests tied to ARR impact. Churn reasons mapped to product gaps. The field intelligence your roadmap is missing.
The PILLAR Blueprint is a free diagnostic that scores your GTM organization across all five structural pillars, identifies your maturity tier, and surfaces the value opportunity hiding in your current setup. Your results are yours - no commitment, no pitch.
Blueprint: see exactly where your revenue architecture stands - 20 minutes, no commitment.
Demo: walk through the platform live with the founder.
See a sample report first →
Want expert interpretation? Facilitated sessions with a PILLAR GTM Engineer are available for qualifying teams.
One structural idea per week. No spam. Just architecture.
Not ready for the Blueprint? See why 8 competitors scored below 5 →
These are PILLAR's own figures: what the platform does, what it costs, and what we have measured inside our own deployments. They are first-party claims rather than independent measurements or market benchmarks, and nobody has audited them but us.
Figures describing school districts, their funding or their spending come from public records and carry their source where they appear.
Anything describing value delivered is an outcome we have observed, not a guarantee of yours. Every figure here is covered by our standing correction offer.